JAXA: Provision of “Kosa Analysis Chart”: Past / Present / Future Dust Distribution
JAXA: “Kosa analysis prediction map”
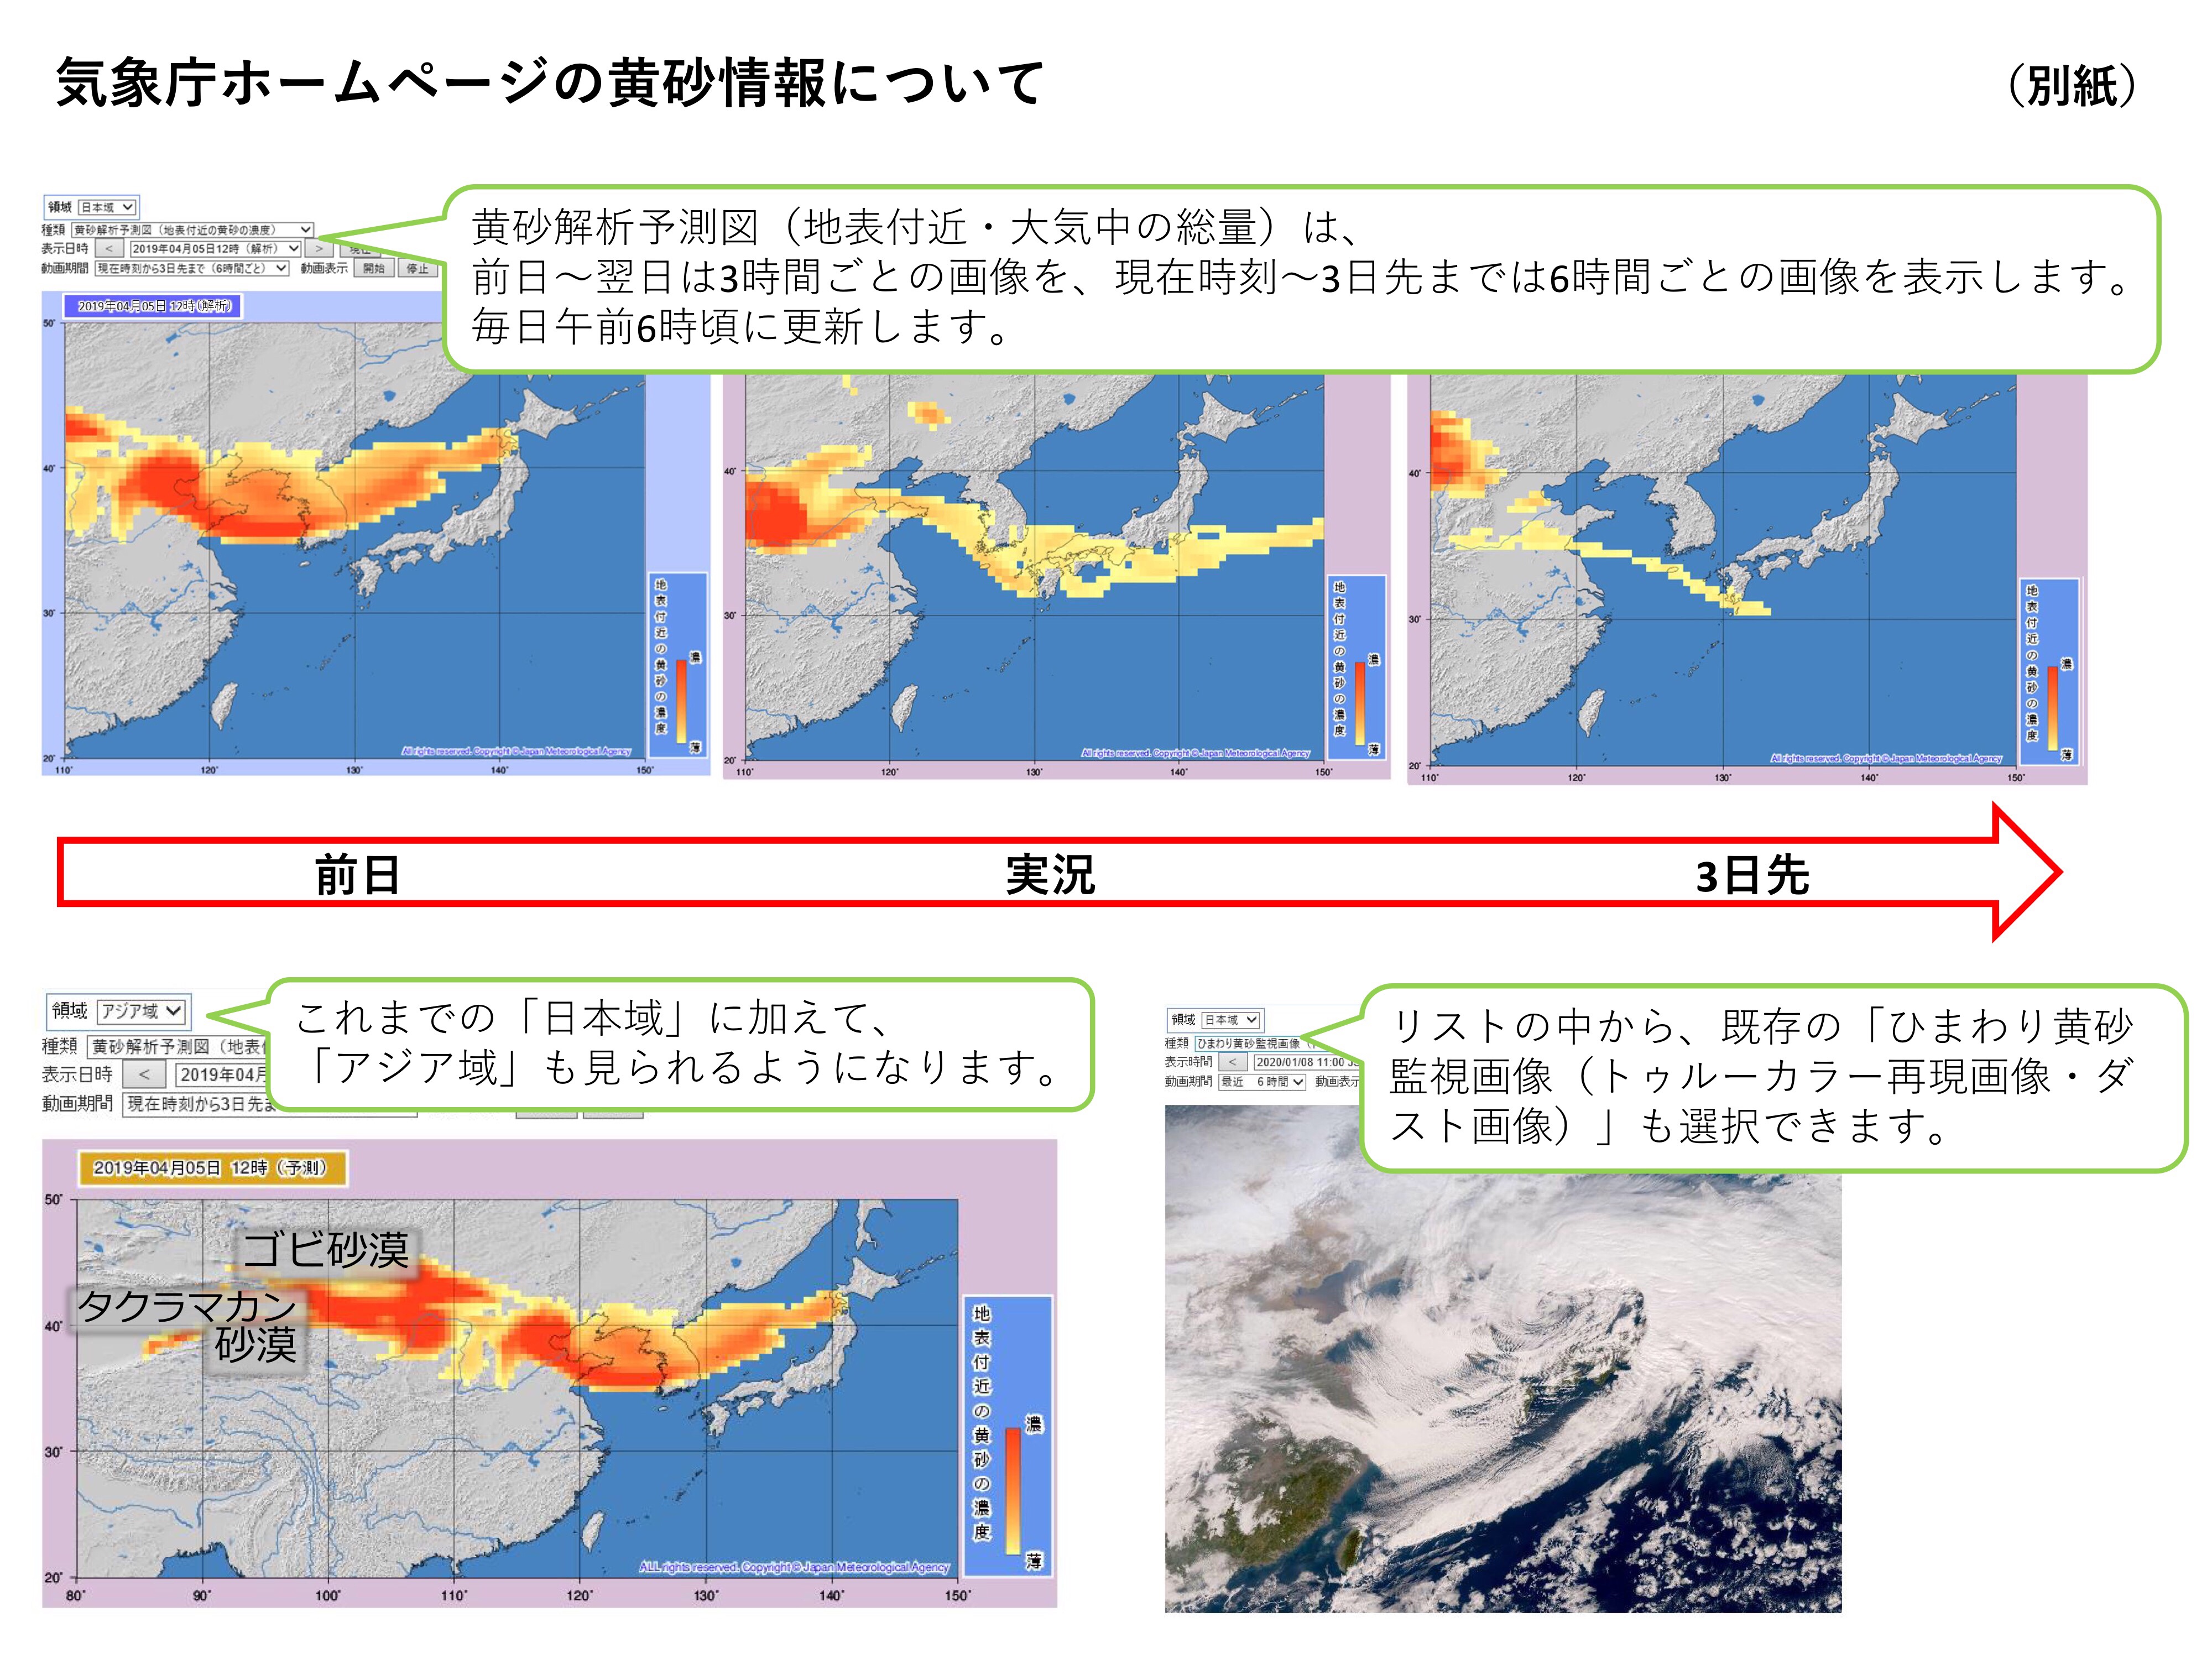
On the Japan Meteorological Agency website,
From January 29, 2020, we will provide a “Kosa Analysis Prediction Chart” that shows the distribution of Kosa in the past, present and future in a continuous and sectional manner.
“Forecast 3 days ahead from the arrival situation of the previous day of the yellow sand” is displayed continuously and in two dimensions.
Display target area:
In addition, the display area has been expanded to include the area that includes major yellow sand sources (Gobi Desert and Taklimakan Desert).
With this, it is possible to grasp the situation of occurrence and arrival of yellow sand over a wide area at an early stage with time.