Rare earth embargo: China strikes back!
・China occupies 85%-99% of rare metal refining
・US military radar and magnetic materials to run out
Summary from Yahoo! article.
China to freeze rare earth exports:
On April 4, the Chinese government announced that it would place export restrictions on seven types of rare earths.
Chinese businesses must apply for rare earth exports each time.

China’s “rare earth” regulations: Explanation and timing (Figure 1)
On April 14, media around the world began reporting “China’s rare earth freeze.”
1. Figure 1 shows the Chinese government’s “rare earth regulation content and timing.”
2. Created based on the websites of the Chinese government’s Ministry of Commerce, General Administration of Customs, and State Council.
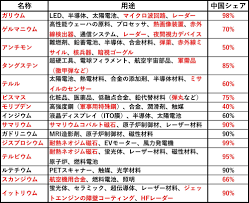
Rare earths regulated by China: element names, uses, and China’s share (Figure 2)
1. Explanation of the element names and uses of the rare earths subject to regulation.
2. We also created a list of China’s approximate global share.
The items in red are for military use.
US fighter radar: Uses gallium nitride: (1st line of Figure 2)
As of June 28, 2021, the most advanced radars for US fighter jets use gallium nitride.
1. Line 1 of Figure 2: China’s share of that gallium is 98%.
2. The most advanced radars for US fighter jets use Chinese gallium.

US military optical systems: Uses germanium (2nd line of Figure 2)
Line 2 of Figure 2: Germanium is used to manufacture “military optical systems.”
1. With a 50% dependency on China, the US wants to secure germanium through domestic recycling.
2. If China decides to impose an embargo, it will be a major problem for the US military.
Imports of dysprosium and terbium: China’s share is 99%:
Dysprosium and terbium are listed in the fifth and fourth rows from the bottom of Figure 2.
1. “Heat-resistant neodymium magnets” are used for US military fighter engines.
2. China’s global share is 99% and 95%, respectively.

Imports of yttrium: China’s share is 90% (last row of Figure 2)
Yttrium is used in engine coating, HF radar, and precision leather.
1. Last row of Figure 2: China’s share of yttrium is 90%.
2. It is difficult for the US military to procure it from anywhere other than China.
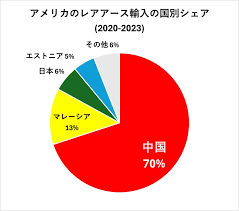
United States rare earth imports by country share: (Figure 3)
The United States imported 70% of its rare earths from China in 2020-2023.
1. In 2021-2023, the US’s total import dependency on rare earths will be over 95%.
2. In other words, “70% of that will come from imports from China.”

2024 Rare Earth Ore Production by Country: (Figure 4)
Figure 4 shows the country share of rare earth ore (rough ore) production in 2024.
1. China is strong in rare earths because it has the world’s best refining technology.
2. The US also has rare earth ore, but a “refining process” is required.
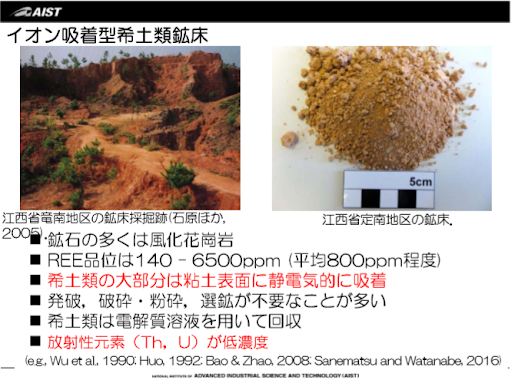
“Ion adsorption deposits”: Only found in Jiangxi Province, China:
1. “Ion adsorption ores” from which rare earths are extracted are only found in Jiangxi Province, China.
2. “Ion adsorption ores” are ores in which rare earth elements are “adsorbed in the form of ions” to clay minerals such as granite.
3. “Ion adsorption deposits” are not found anywhere other than China.
Extraction of gallium: raw aluminum ore
1. Gallium is mixed in trace amounts with raw aluminum ore.
2. Aluminum is extracted by refining crude ore to extract pure aluminum.
3. Gallium is found in the ore after the aluminum is removed.

Extraction of cobalt: raw copper ore:
1. Cobalt is mixed in trace amounts with raw copper and nickel ore.
2. Cobalt is extracted in the same way when copper is refined.

“Trump tariffs”: iron and aluminum tariffs announced:
China has rapidly expanded rare earth production in the process of increasing production of iron and aluminum.
The aim of the “Trump tariffs” is to “stop the cycle of simultaneous production of base metals for Chinese manufacturing” and rare earths.

Figure 7: Aluminum production trends in major countries
This is from the USGS Mineral Commodity Summaries.
To prove this, I plotted the trends in aluminum production.

Figure 8: Crude steel production trends in the US, China, Japan, India, Russia, and the former Soviet Union (1969-2023)
What do you see when you look at Figure 7 and Figure 8 at the same time?
1. On the surface, China’s base metals dominate the world.
2. China can maintain its world top position with its “by-product” “rare earths.”

Warnings about China’s environmental problems:
1. To extract rare earths, chemicals such as ammonium sulfate, hydrochloric acid, and nitric acid are used.
2. However, soil acidification and water pollution occur, leading to soil and environmental problems in China.
https://news.yahoo.co.jp/expert/articles/6ff98db63d936a763909a7f46cc65d065be9718d