US-China Trade Friction: China’s Import Trends with the United States (1Q 2019)
US-China trade friction seen by data
June 07, 2019
China third installment: June 1 additional tariff rate raise
China raised the additional tariff rate from June 1 as a third bullet against imported goods of the United States (see the article of May 14, 2019).
The first of July 2018,
The second of August 2018,
Currently, over 6,000 items are subject to additional tariffs.
Global Trade Atlas (GTA): (Attachment)
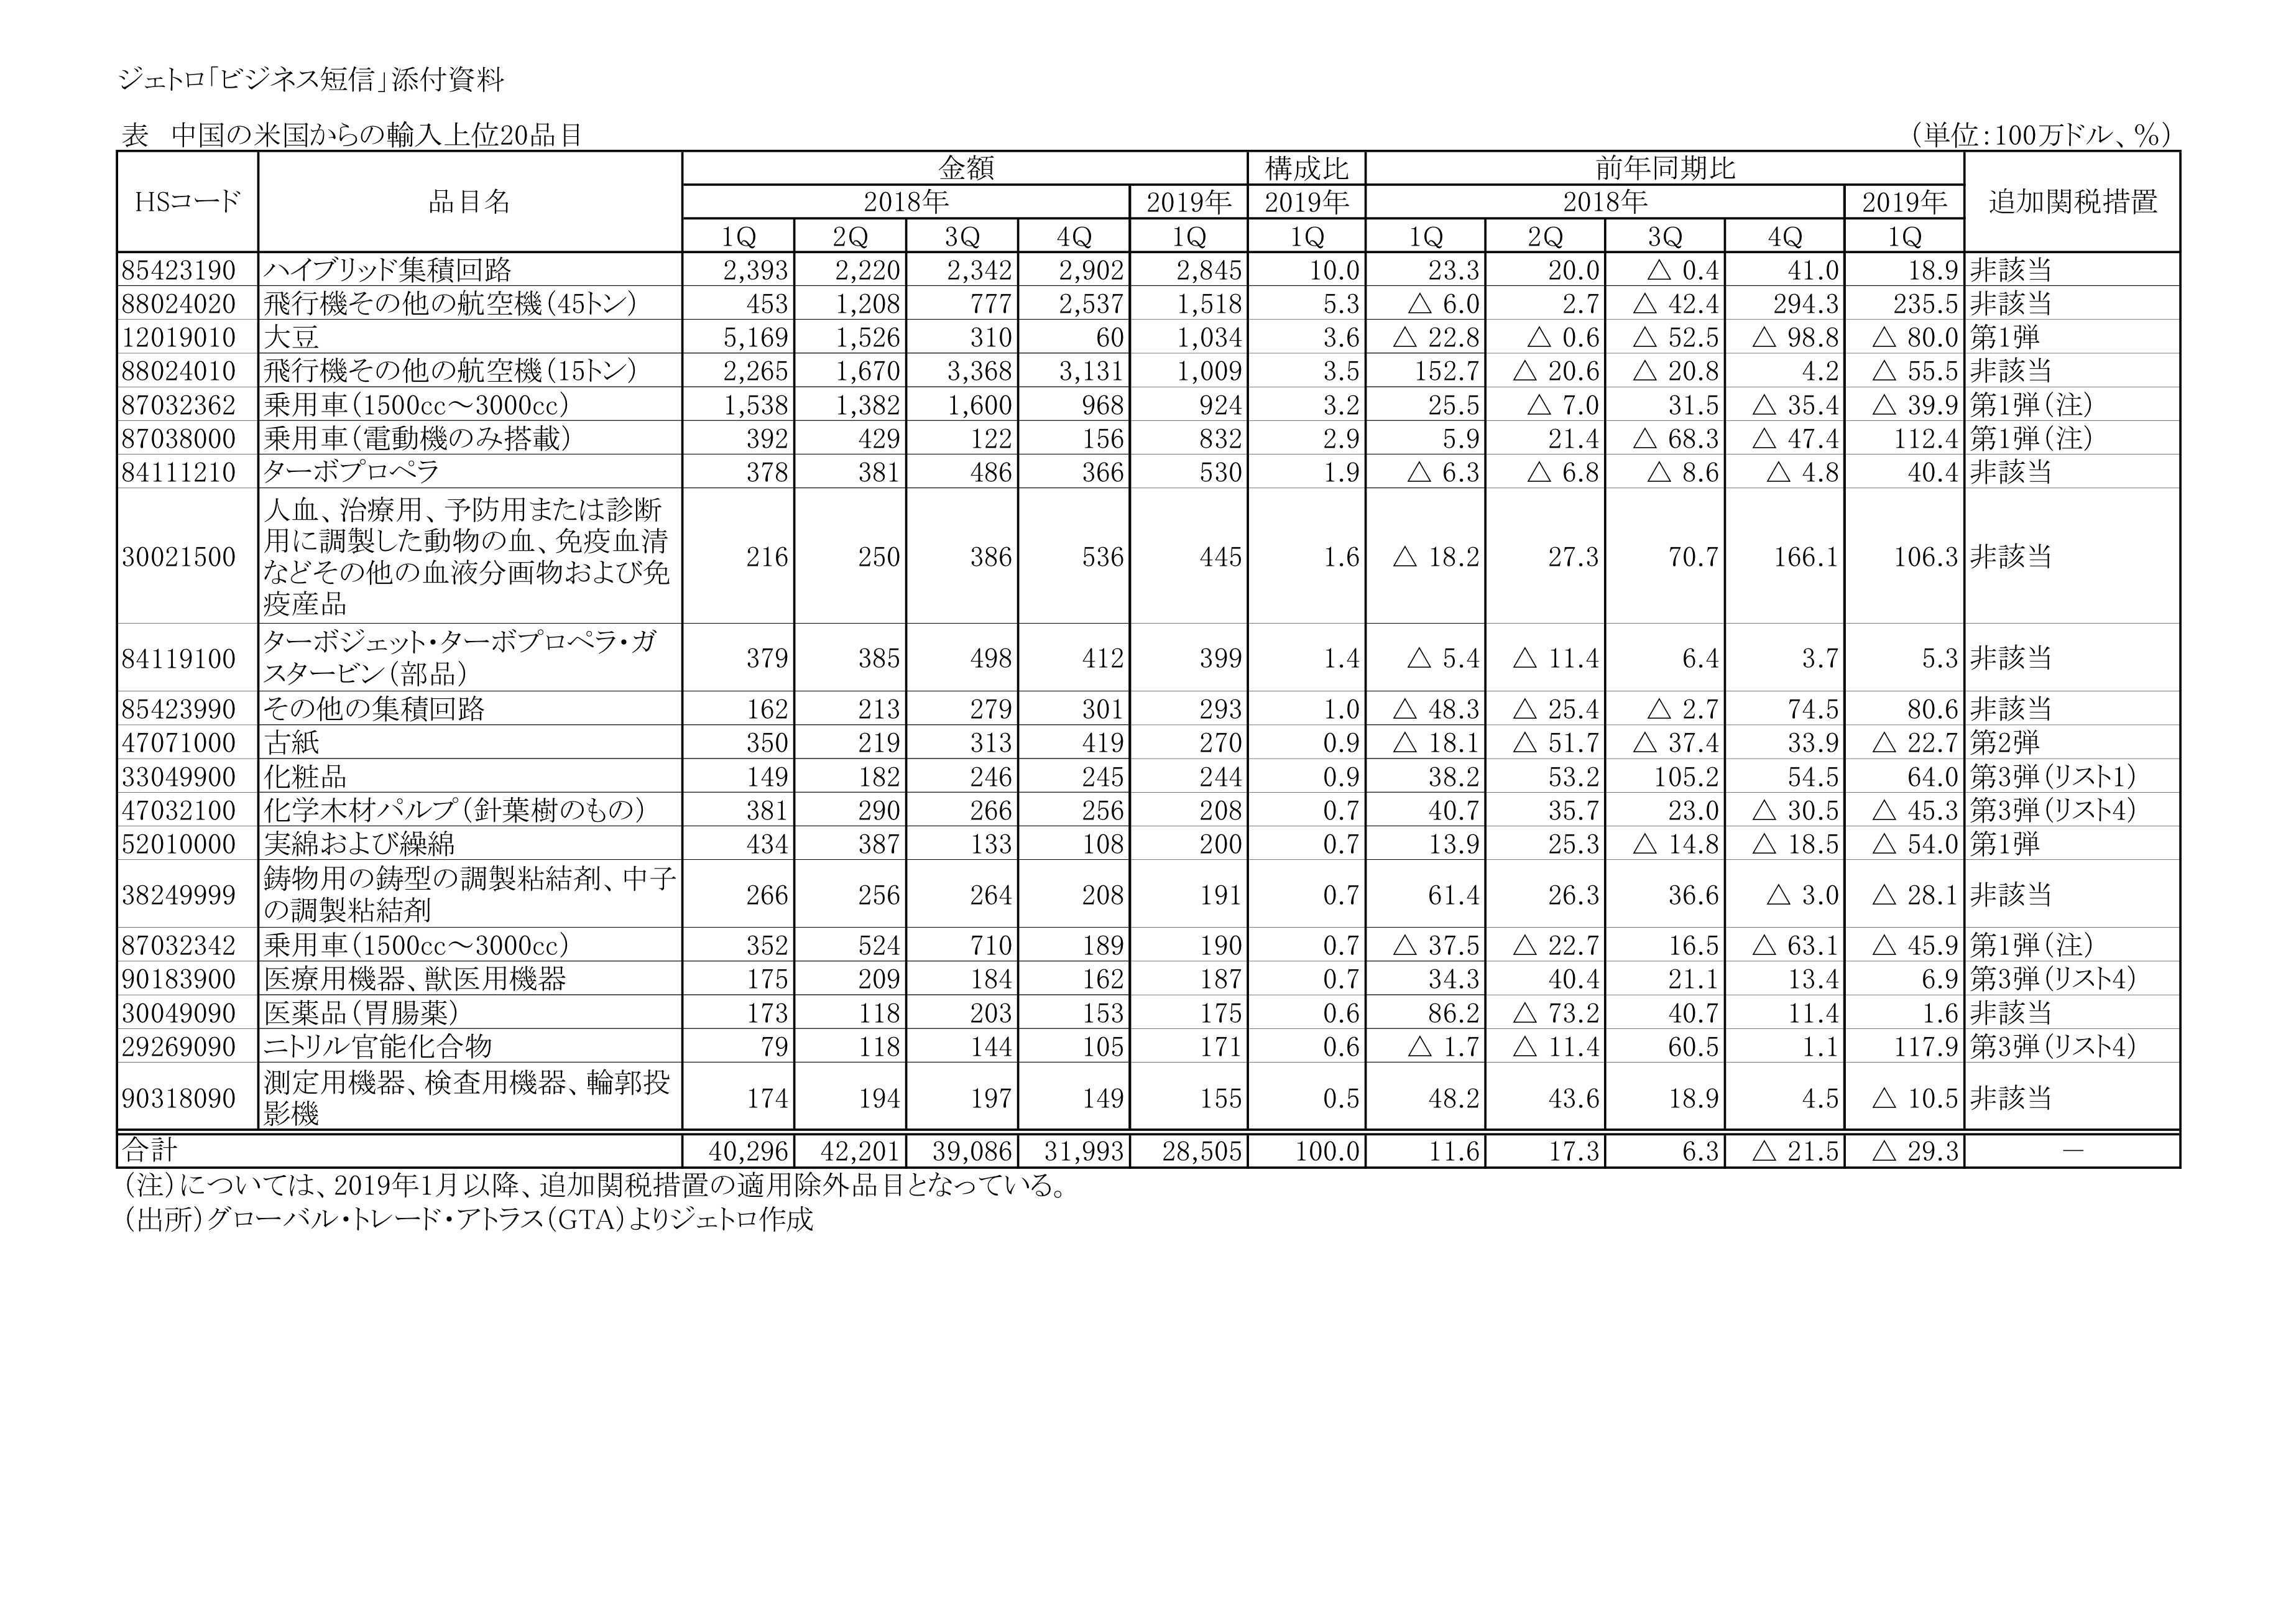
Imports from the US for the full-year in 2018 were up 3.5% from the previous year (see the article on June 5, 2019),
First quarter of 2018 and 2019: Imports from the US (see attached)
Additional tariff measures were triggered simultaneously in the third quarter of 2018.
The fourth quarter of 2018, down 21.5% from the previous year,
In the first quarter of 2019, it decreased by 29.3% compared to the previous year,
Imports from the United States have been on a significant downtrend.
Top 20 import items: (first quarter of 2019)
Soybean (80.0% decrease),
Passenger cars (87032362: 39.9% down, 87032342: 45.9% down),
Real cotton (54.0% decrease) (above, the first bullet),
Waste paper (22.7% decrease) (the second),
Chemical wood pulp (down 45.3%) (3rd bullet list 4) recorded a 2 digit decrease.
The import trend in April 2019 continued to decrease sharply by 25.8% from the same month last year.
There is also the impact of the additional tariff rate (5-25%) on the third ($ 60 billion) launched from June 1st.
We need to keep an eye on imports since May.
-JETRO
https://www.jetro.go.jp/biznews/2019/06/474d0d456027c4c3.html