
367 cities in China: Thorough investigation of aging ranking
– 185 cities in China are found to be an aging society
– 150 cities in China found to have a declining population
– Due to economic slowdown, ‘discontinuation of publication of inconvenient data’ occurs one after another
We bring you a summary from the NHK special broadcast article.
Statistical data released by the National Bureau of Statistics of China:
The NHK reporting team looked into statistical data from the National Bureau of Statistics of China.
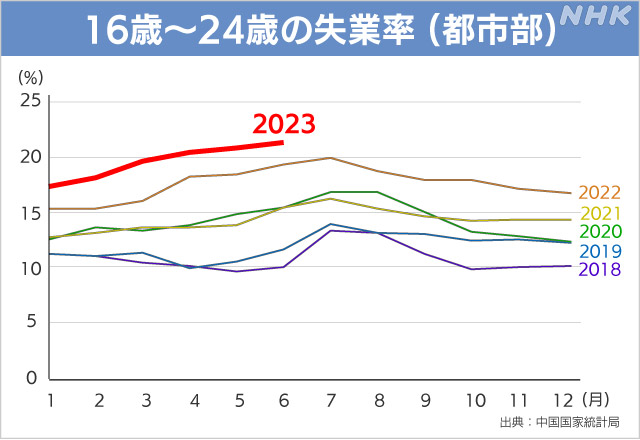
China’s economic recovery is slowing down. Employment anxiety spread among young people.
Unemployment rate by age announced since 2018. The unemployment rate for 16- to 24-year-olds in urban areas hit an all-time high in June of this year.
Discontinuation of publication of unemployment rate by age group:
In August, the National Bureau of Statistics said it wanted to more accurately reflect the reality of unemployment rates by age group.
For the time being, the government has announced that it will stop publishing unemployment rates by age group.
Since July, ‘important data has not been made public’.

NHK thoroughly investigates the truth:
Statistical data is essential for viewing economic trends.
In China, updating of national statistical data that is inconvenient to China has stopped.
How many are actually stopped?
This time, the program’s reporting team conducted a thorough investigation.
Stop publishing inconvenient data:
It has been discovered that various data have stopped being updated since 2013, when Xi Jinping became president of the country.
NHK’s own verification revealed various problems.
What is the reality of Chinese statistical data?
(The truth behind China’s “economic stall” reporting team)
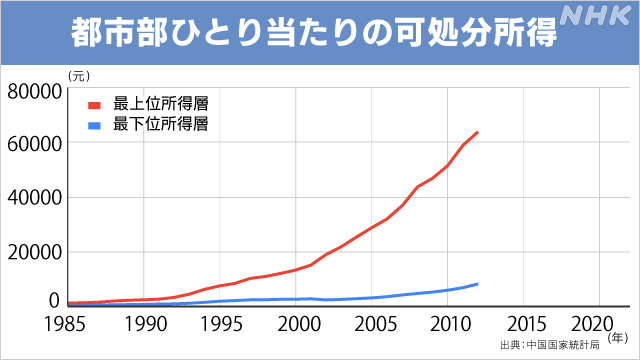
ublication of disposable income in urban areas has also been discontinued:
‘Disposable income per capita in urban areas’ is an indicator of China’s widening inequality.
Since 1985, it has been publishing the 10% income of the top group and the 10% income of the bottom group.
Both have been suspended since 2012.
*Note: Per capita disposable income data for income quintiles (20% increments) continues to be announced.
NHK independently researched using the CEIC database:
Data from the National Bureau of Statistics of China:
I investigated using the database CEIC, which contains statistical data on China.
How much data is withheld from publication?
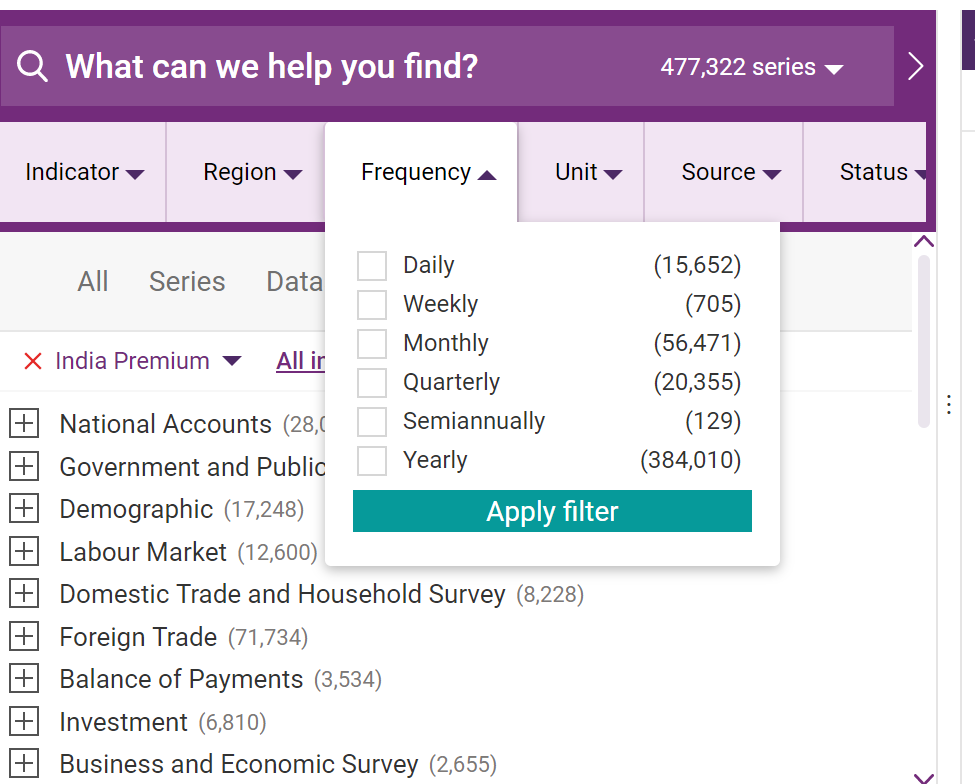
What is CEIC database:
It is used by Chinese economic experts in their research.
China Premium Database contains 820,000 pieces of data released by China’s central and local governments.
How much data can I check each year with CEIC?
CEIC has a “start year” and “end year” written on it.
Number of annual data published by CEIC:
This time, I investigated the number of data items under the following conditions.
[Condition] CEIC China Premium Database
1 Data source is “National Bureau of Statistics of China”
2 “Annual” data
3 “We have data for more than 5 years”
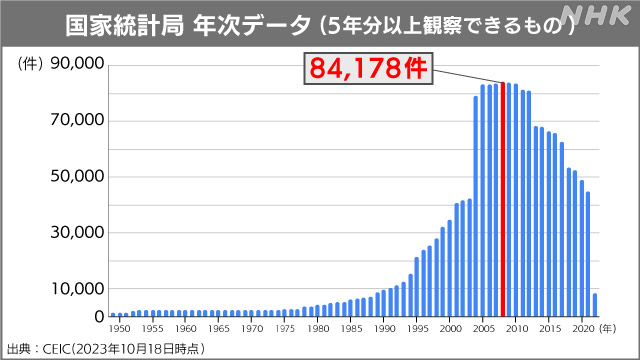
A total of 91,636 pieces of data met these three conditions.
I made a bar graph of the number of published data for each year.
The highest number was 84,178 in 2008.
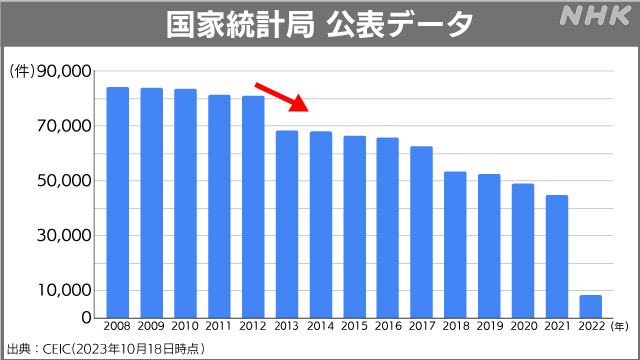
Number of publications since 2008:
1. In 2010, China overtook Japan to become the world’s second-largest country in terms of GDP.
2. After that time, the number of published Chinese statistical data decreased.
Especially in 2013, when Xi Jinping became president of the country.
3. The number of publications in 2013 decreased by 10,000 compared to the previous year.
4. The number of published cases in 2021 has also decreased by more than 40% compared to 2008, which was the highest year

Analyzing local city data:
Next, we analyzed local finance.
A detailed investigation was conducted not only at the level of “provinces and directly administered territories/autonomous regions.”
We investigated economic data for more than 300 “prefecture-level cities”.
Difficult to obtain “population” data:
Data on population was difficult to obtain.
Statistical yearbooks for each city are available on the Internet.
However, there is no detailed population data by age or occupation.

Calculated by “Census”:
So, after interviewing experts, we obtained a “Census.”
China’s once-in-a-decade census:
The national census is the only data (not estimates) that can provide a detailed picture of China’s population.
The results for 2010 and 2020 are not published on the internet.
I read it directly from the “Census” data.

Calculate the aging rate using the “Census”:
The 2010 and 2020 census population data are each 1,000 pages long.
However, the “Census” materials have not been converted into data.
We manually entered over 360 cities. Then, we summarized the ‘population by age group by 5 years’ in spreadsheet software.
NHK focuses on “aging”:
What is an “aging society”?
In general, when the proportion of elderly people in the population reaches 7%, it is called an “aging society”.
What is “aging society”?
When the proportion of elderly people in the population reaches 14%, it becomes an “aging society”
Population data for each city, male and female, and 5 years old was examined by detailed residential area.
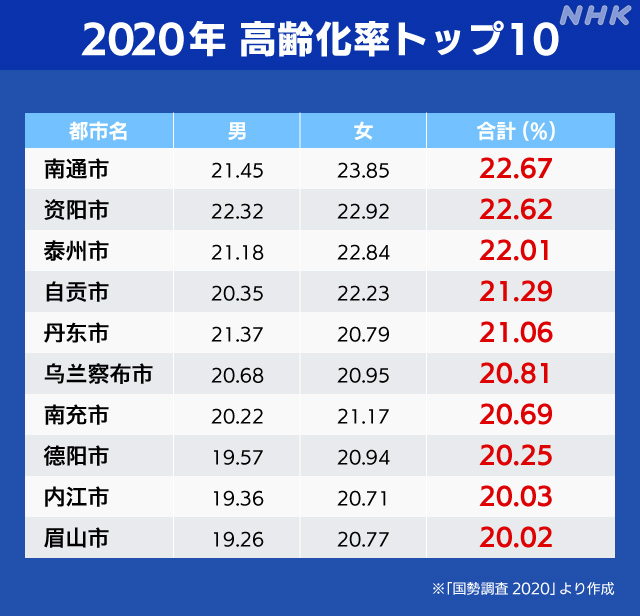
“Aging society” in 2020:
In 2020, 185 out of 367 cities fall under China’s “aging society.”
It was found that 155 cities fall under the category of “aging society.”
The top 10 cities with the highest aging rates are shown in the figure.
Even Bizan City, which came in 10th place, had a rate of over 20%.
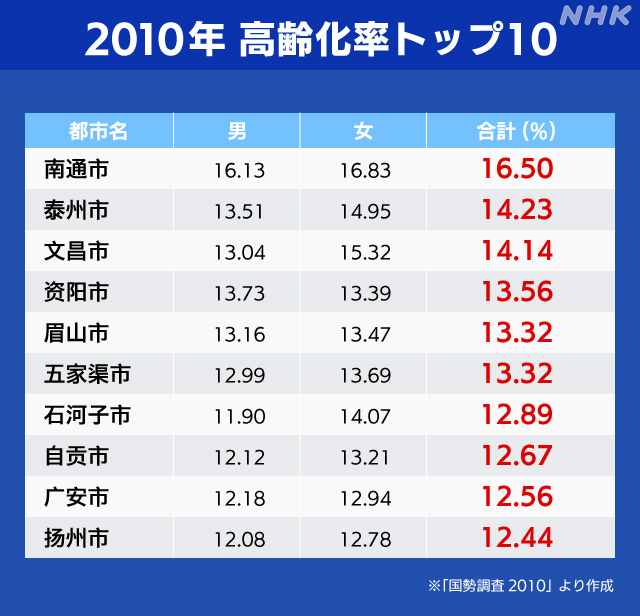
“Aging society” in 2010:
The 2010 survey results:
Of the 293 cities with an “aging society,” only three cities had an “aging society.”
Over the next decade, the number of China’s “aging society” cities increased by 50 times.
The reality of China’s rapidly aging population has been revealed.
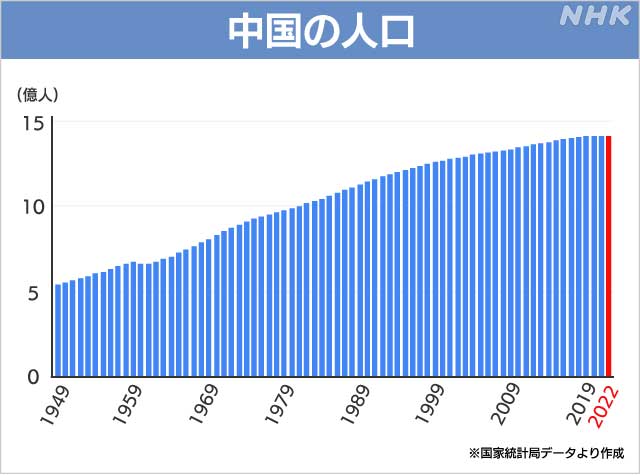
Investigating population decline at the city level:
China is not only facing an aging population.
In January of this year, it was announced that China’s population would decline for the first time in 61 years.
The population at the end of 2022 was 1,411.75 million people, a decrease of 850,000 people compared to the previous year.
Population decline in 150 cities:
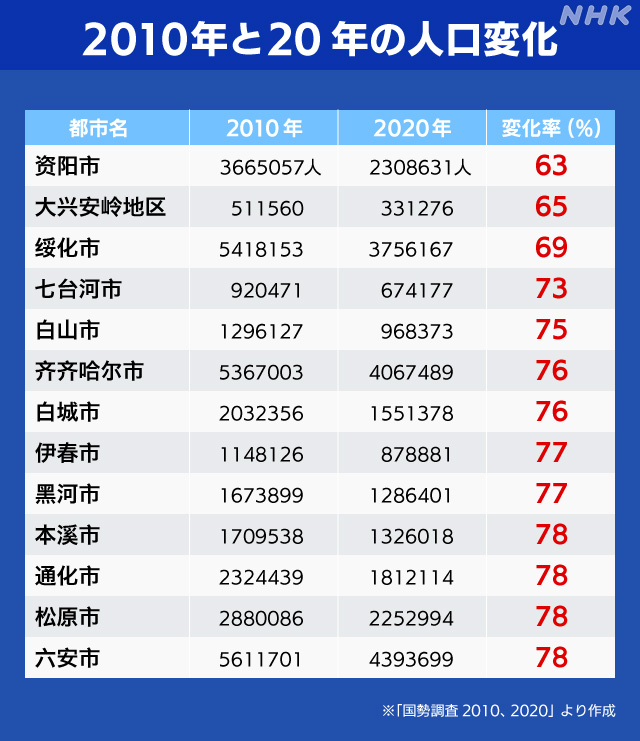
What would happen if we looked at population decline in more detail at the city level?
Calculated using the 2010 census value as the standard (100).
In 2020, 150 cities, more than 40% of the total, were found to have a declining population.
The cities that experienced particularly large changes are shown in the diagram.

Population decline in all cities in Heilongjiang Province
Heilongjiang Province had become an “aging society,” with the population declining in all cities.
Qiqihar has an aging rate of approximately 16% and a 10-year population decline rate of 24%.
Across Heilongjiang Province, social security expenses have increased 3.4 times compared to 10 years ago.
It appears that the reserve fund has already run out.
https://www3.nhk.or.jp/news/html/20231117/k10014258651000.html