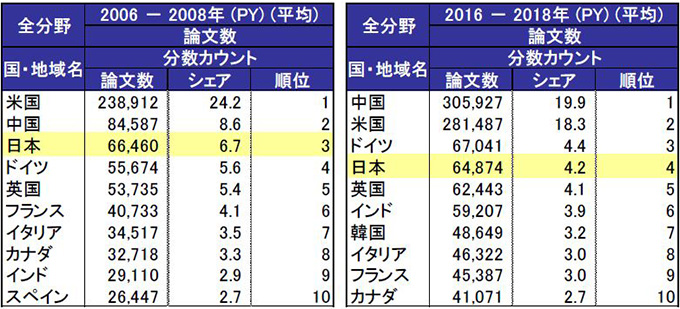
Number of papers by country/region: Top 10 in 2006-08 and 2016-18 (provided by NISTEP)
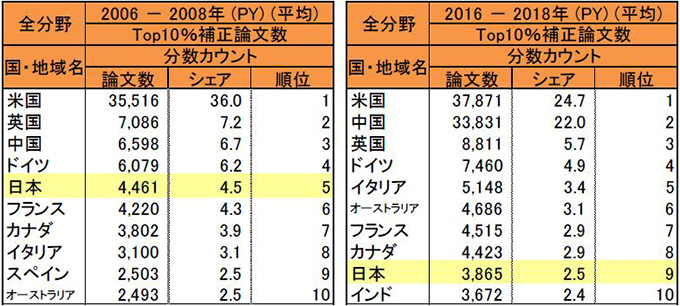
Top 10% of the number of papers corrected in 2006 to 2008 and 2016 to 18 respectively (provided by NISTEP)
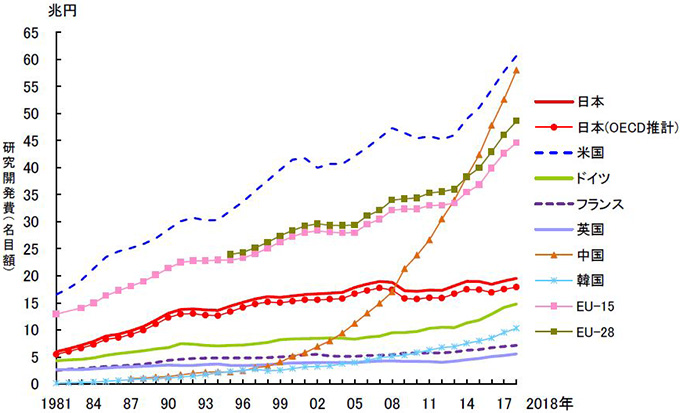
Changes in total R&D expenses in major countries (provided by NISTEP)
Number of papers in the world: China ranks first for the first time without the US: Science and Technology Index 2020
Number of papers in the world:
August 12, 2020
Japan fell to fourth place in the number of papers.
On the other hand, the number of applications to multiple countries remains the top.
Ministry of Education, Culture, Sports, Science and Technology: Institute for Science and Technology Policy (NISTEP)
We have systematically analyzed the science and technology activities of the world’s major countries and published the Science and Technology Index 2020.
“Science and Technology Indicators 2020”:
Number of natural science papers:
China won first place in the world after surpassing the United States. Japan is 4th.
Number of high-profile papers:
Japan is ranked 9th, and both indexes have fallen from 10 years ago.
Number of patent applications to multiple countries:
On the other hand, in terms of the number of patent applications filed in multiple countries, Japan has maintained its top position last year and last year.
Published in Scientific Journal: Natural Science Papers
As one of the main indicators, we analyzed the papers of natural sciences published in scientific journals during the survey period of 2016-18.
Since there are many international co-authorships in natural science papers, the number of papers was corrected taking into account the degree of contribution to papers by country (fractional counting method).
The average annual number of papers during the survey period is approximately 1.54 million (annual average).
The most recent 2018 was about 1.6 million.
Number of papers per year:
China: 305,900 bottles, share 19.9%,
US: 281,500, 18.3%
Germany: 67,000 bottles, 4.4%,
Japan: 64,900 bottles, 4.2th percentile,
China: For the first time since the analysis started in 1981, it ranked first.
Japan: This time, I was overtaken by Germany and fell from 3rd to 4th.
“High-profile papers”:
The “high-profile paper” is often cited in other papers.
I checked it with “Top 10 percent corrected number of papers”.
1st place: US share 24.7%
Second place: 22.0% of China
9th place: 2.5% in Japan
20 years ago (6.1%, 4th place),
10 years ago (4.5%, 5th place),
By comparison, the decreasing tendency is remarkable.
2018 R&D expenses: (OECD estimate) Yen conversion
1st place: 60.7 trillion yen in the US,
2nd place: 58.0 trillion yen in China,
3rd place: Japan is 17.9 trillion yen
On a national basis, it remained in third place, more than Germany or the United Kingdom.
China is the fastest growing of the major countries, with an increase of 10.3% over the previous year.
Number of researchers in 2019:
1st place: 1.86 million people in China,
2nd place: 1.434 million in the United States.
3rd place: 678,000 in Japan
Number of patent applications to two or more countries (2013-15): Number of patent families
Focusing on patent applications, we measured the possible international comparison of the number of inventions in each country.
In the number of patent families (2013-15),
Japan:
61,800 cases, share 26.3%.
It stayed ahead of the US and Germany as it was ten years ago.
USA:
The United States in second place was 54,200 with 23.0%.
China:
The number and market share have increased significantly, from 8th place 10 years ago to 5th place.
SciencePortal
https://scienceportal.jst.go.jp/news/newsflash_review/newsflash/2020/08/20200812_01.html